Pivot table excercise
Posted: February 27, 2013 Filed under: Fun | Tags: pivot table, Plot Leave a commentI’ve tried teaching once: I was asked to explain pivot tables – very useful tool. However to demonstrate how that works and what are advantages of it we need table. This post is more about generating data than using a table – but it is still something interesting. At least for me.
 What this time?
This time we need to create big data set. Pupil was food technologist so I decided to make up products database – as if we were working in department store.
Firstly I decided on parameters that will describe each product. Let it be 8 categories. In each category we have 1 or two providers (sometime one provider is present in more than one category). And we have 4 items in each category. Our spreadsheet will choose from this set and then randomly decide whether item is “ecologic” or available in bargain. Other characteristics consist of size of packing and energetic value. Latter parameter is somewhat constrained – if it would be totally random we could get salad that is more energetic than butter. Also size of item counts. Lastly price is calculated taking into account almost all other parameters. We have 1500 unique items in our database. Yes, they are sometimes unimaginable, but that’s not the point.
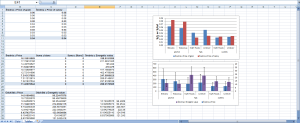
In second spreadsheet we have example tables that could be generated with this database. We can see for example that price of a kilocalorie is higher than price of gram for alcohol and it is reverse for fats. Second plot is a little show-of; it simply presents average price and energetic value of products in different scales (one trick was made to make it possible – see the table). And values of error bars are provided… form another pivot table.
Sum up:
It’s my kind of work as I like to generate heaps of statistics. But at some point it is important to present them in digestible way. Once it helped me organizing data from 16 external references (a few MB of numbers each) – both with embedding. And bosses were pleased with effect. But this maybe some other time.
Furthermore pivot tables are easy. Really. In modern versions of MS Excel it is a matter of putting ticks in right squares and moving squares all over the screen – it’s that easy.